Loading Guild Resources
Loading Guild Resources
Loading Guild Resources
Profits from selling houses are at the lowest for almost a decade, according to data from a leading property firm.
For the first time in three years, pre-tax profits from sales have dipped below £100,000 because more landlords are considering selling their buy-to-let investments due to higher taxes and stricter regulation expected from the Renters Rights Bill.
Consultants and estate agents Hamptons says in 2024, the average household sold their home for £91,820 more than they paid, having owned it for 8.9 years.
This figure has fallen by £10,830 since 2023 and is down from a peak of £112,930 in 2022, when strong house price growth pushed gross gains into six figures for the first time.
The data from Hamptons shows returns from property are at the lowest since 2015.
Last year, sellers sold at an average of 42 per cent more than they paid for a home - down from 48 per cent in 2023.
The Hamptons report said: “This decline in gross profits reflects the cooling of the market after the pandemic-fuelled boom. As mortgage rates rose and economic uncertainty increased, house price growth moderated across the country. Consequently, sellers who bought more recently have seen smaller gains compared to those who purchased their homes a decade or more ago.
“These proceeds typically fuel moves up the property ladder. However, smaller and slower equity gains over recent years, particularly for flat owners, have made this more challenging. Despite lower price gains last year, 91 per cent of households achieved more than they paid.”
The market was better than average for London landlords, but returns were still lower than expected.
Gains failed to hit £200,000 for the first time in ten years, hovering around £172,350 in 2024, compared with £204,690 a year earlier.
Prices were down in every region.
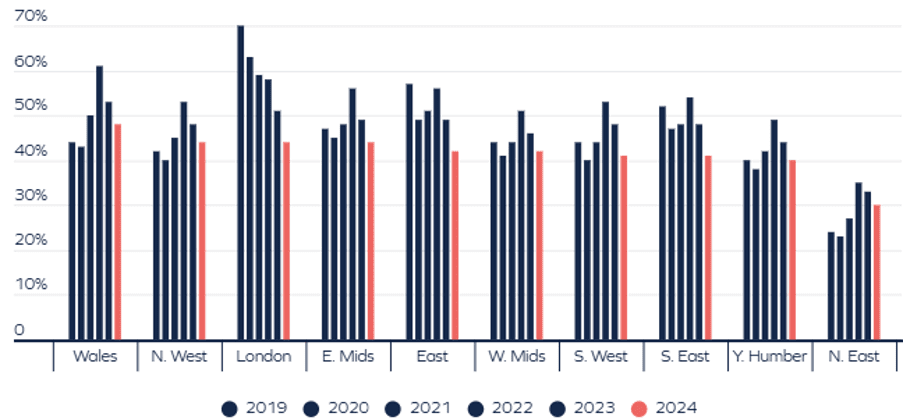
Source: Land Registry and Hamptons
Wales led the way in percentage terms for the third consecutive year, with the average home selling for 48 per cent more than the purchase price.
Rank | Council | Region | Average % difference between sale and purchase price | Average £ difference between sale and purchase price | Years of ownership |
1 | Merthyr Tydfil | Wales | 68% | £59,590 | 9.4 |
2 | Shepway | South East | 64% | £128,500 | 11.3 |
3 | Trafford | North West | 63% | £146,240 | 9.0 |
4 | Blaenau Gwent | Wales | 62% | £44,530 | 9.1 |
5 | Nottingham City Council | East Midlands | 60% | £70,200 | 9.3 |
6 | Barking and Dagenham | London | 60% | £112,520 | 10.7 |
7 | Leicester | East Midlands | 60% | £84,100 | 10.1 |
8 | Rhonda Cynon Taff | Wales | 60% | £53,130 | 8.5 |
9 | Oldham | North West | 59% | £64,800 | 9.9 |
10 | Waltham Forest | London | 59% | £178,750 | 8.4 |
Source: Land Registry and Hamptons